
Between July 6 and 9, a frontal system left rainfall totals that, in several areas, far exceeded what is usual for the season.
Here is a preliminary analysis focused on a key question for risk management: how often should we expect events of this magnitude in any given year?
The metric we use is the return period (T): the average time between events of equal or greater intensity. It doesn’t tell us when the next episode will happen, but it does tell us how unusual the one we just went through was.
What the data show
We analyzed the return period of maximum precipitation for three durations that are critical in applied hydrology (6, 24 and 48 hours), together with the percentage of area affected in each range.
- 24 hours: at first glance, 38% of the area falls in a relatively frequent range (2-10 years). But that figure hides the real risk: about 30% of the analyzed territory experienced rainfall with return periods above 50 years.
- 48 hours: the signal intensifies in several areas, some reaching T>100 years, consistent with the impacts observed on connectivity and basic services.
- 6 hours: more common events dominate, but with local exceptions of greater severity, relevant for rapid runoff generation and urban flooding.
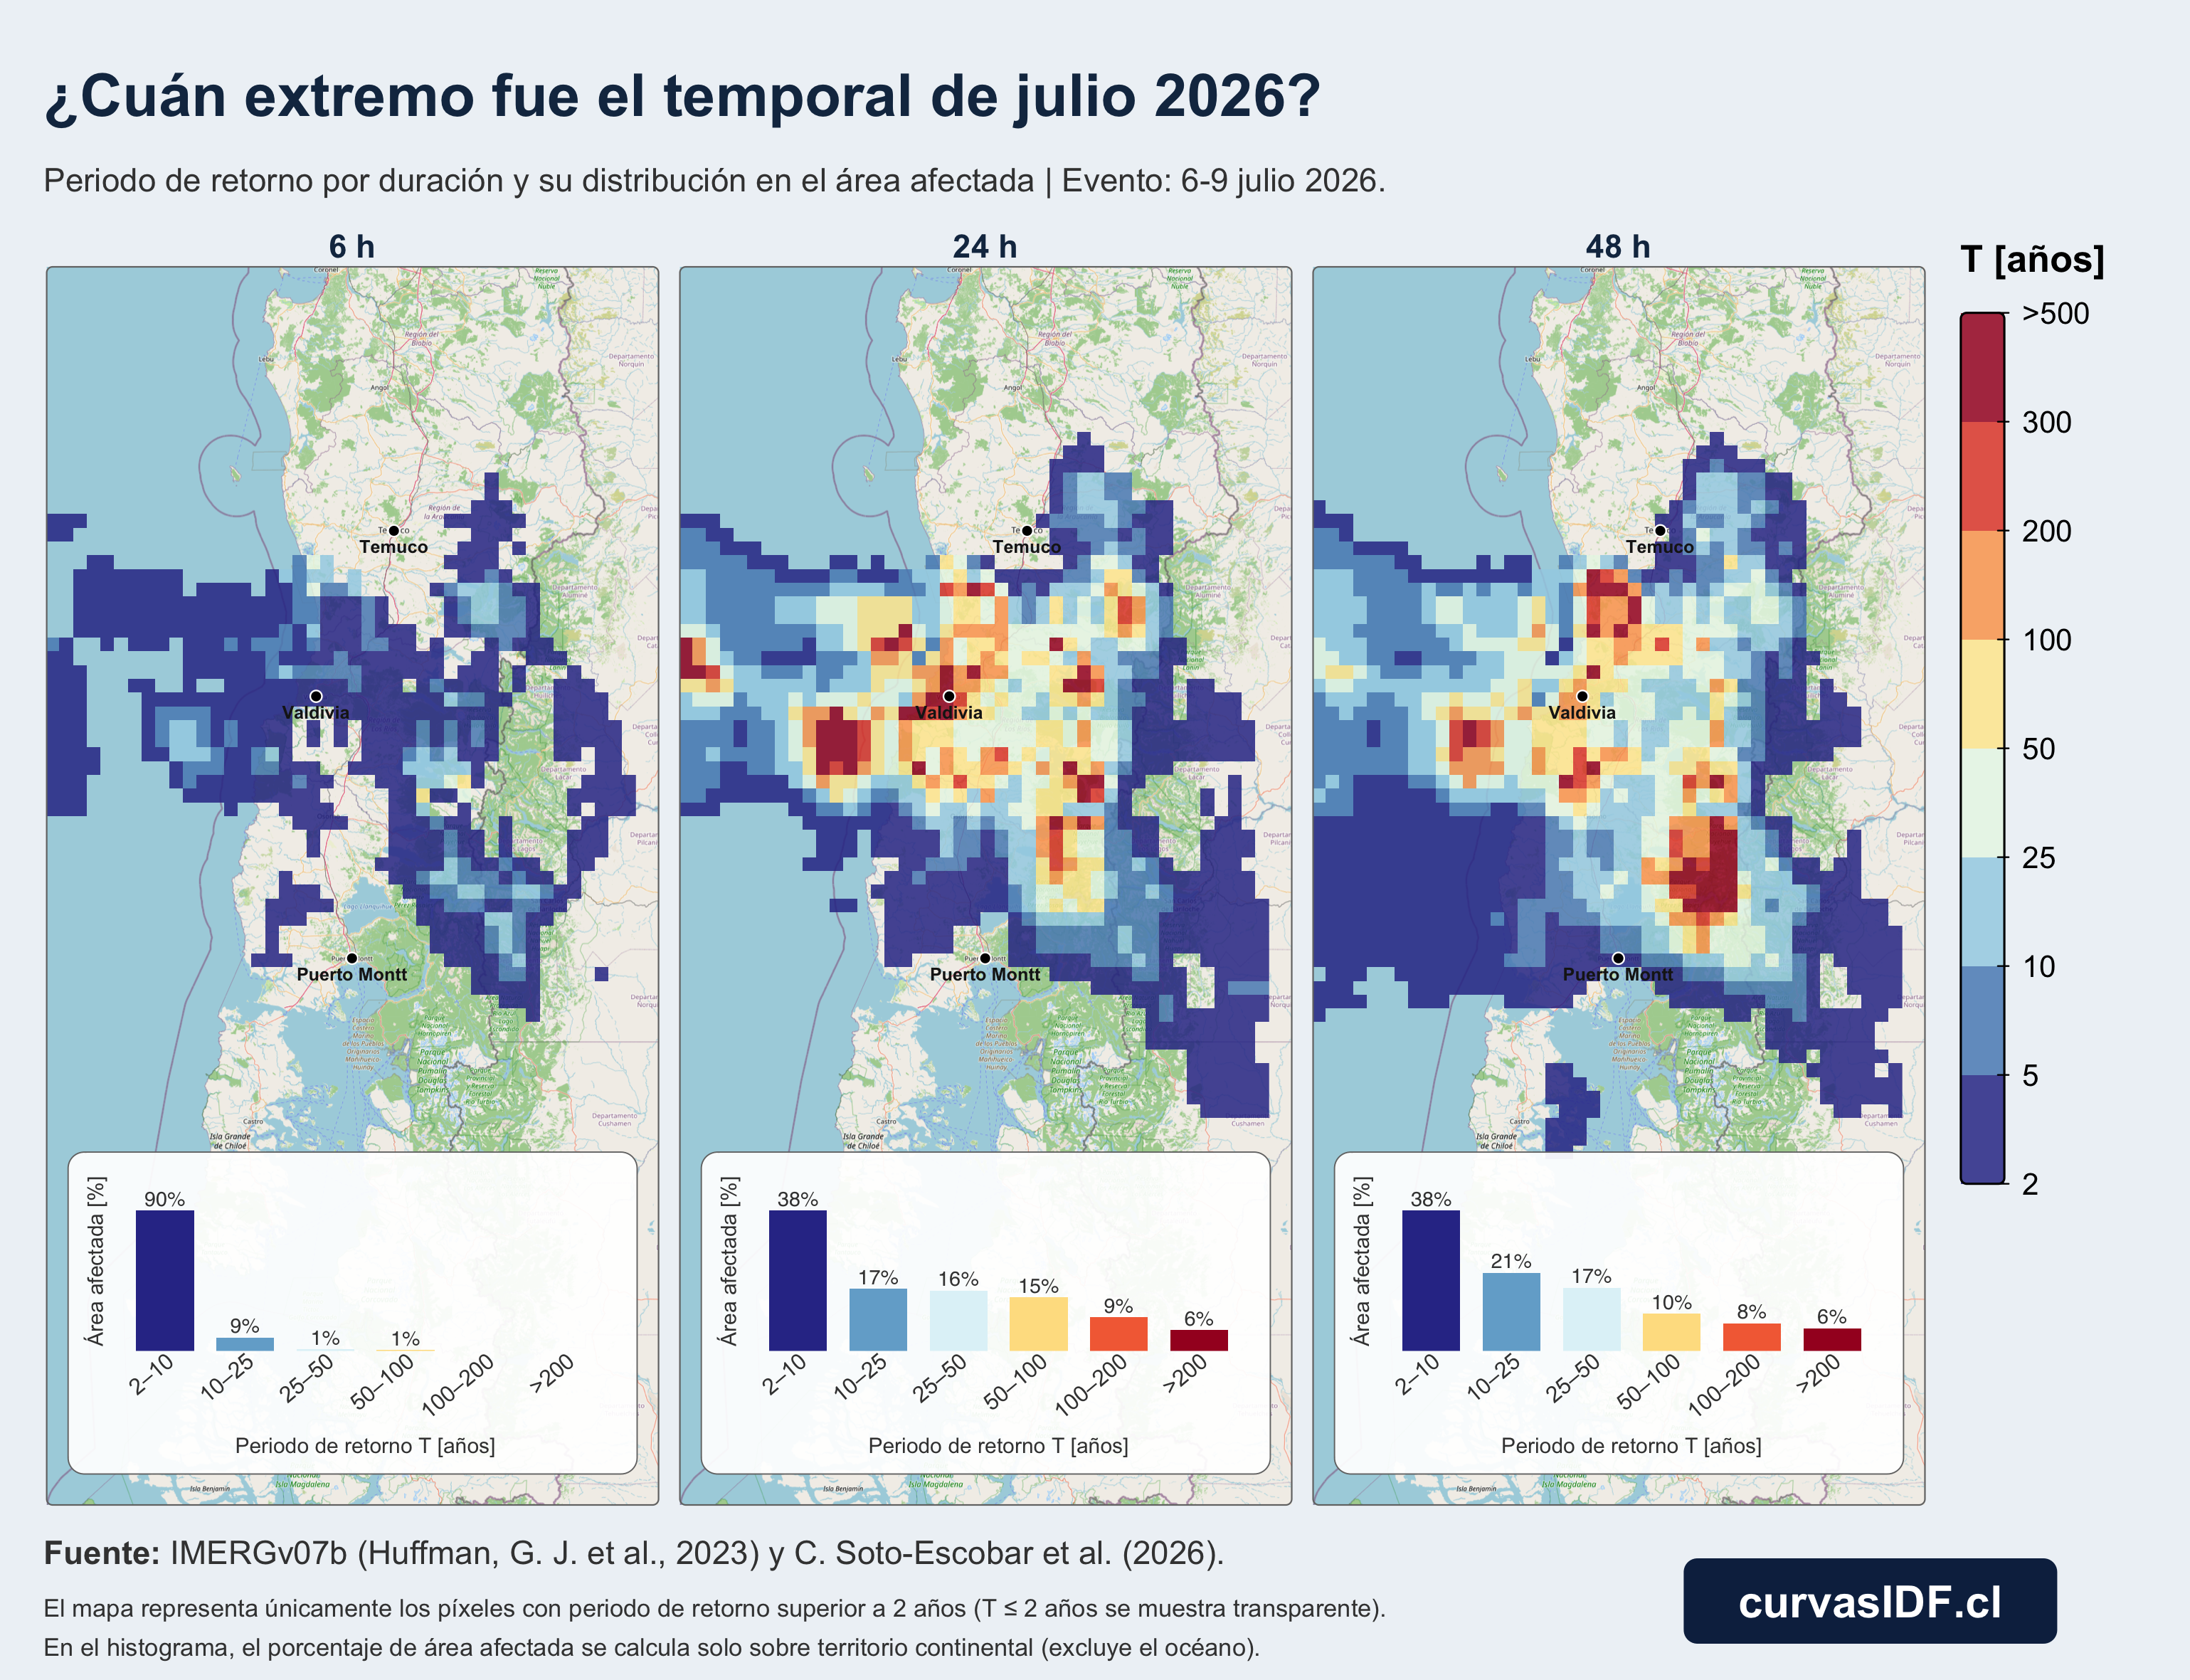
Operational reading: spatial variation is decisive. Within a few kilometers, severity changes abruptly. Designing with regional averages dilutes the extremes that actually cause impacts on infrastructure.
Why does it matter?
After the emergency, public attention fades quickly. But risk reduction is decided before the next front: in how we size infrastructure, update IDF curves and prioritize investments.
With that goal in mind, we developed an open tool for extreme precipitation analysis and hydraulic design support in Chile:
- Tool: curvasidf.cl
- Article: lnkd.in/dgjKYGNG
Implications:
- Urban drainage design: include scenarios of ≥50 years in critical areas, not just the “typical” event.
- Road connectivity: evaluate 24-48 h durations, where the highest return periods are concentrated.
- Land management: map local hotspots instead of municipal averages.
Methodological note: estimates based on IMERG v07B Early. Preliminary analysis subject to data availability and quality control. The map includes only pixels with T > 2 years. The histogram computes the percentage of area over continental territory only (it excludes the ocean).